View analytics
See how your agents and campaigns are performing — volume, answer rates, talk time, and trends.
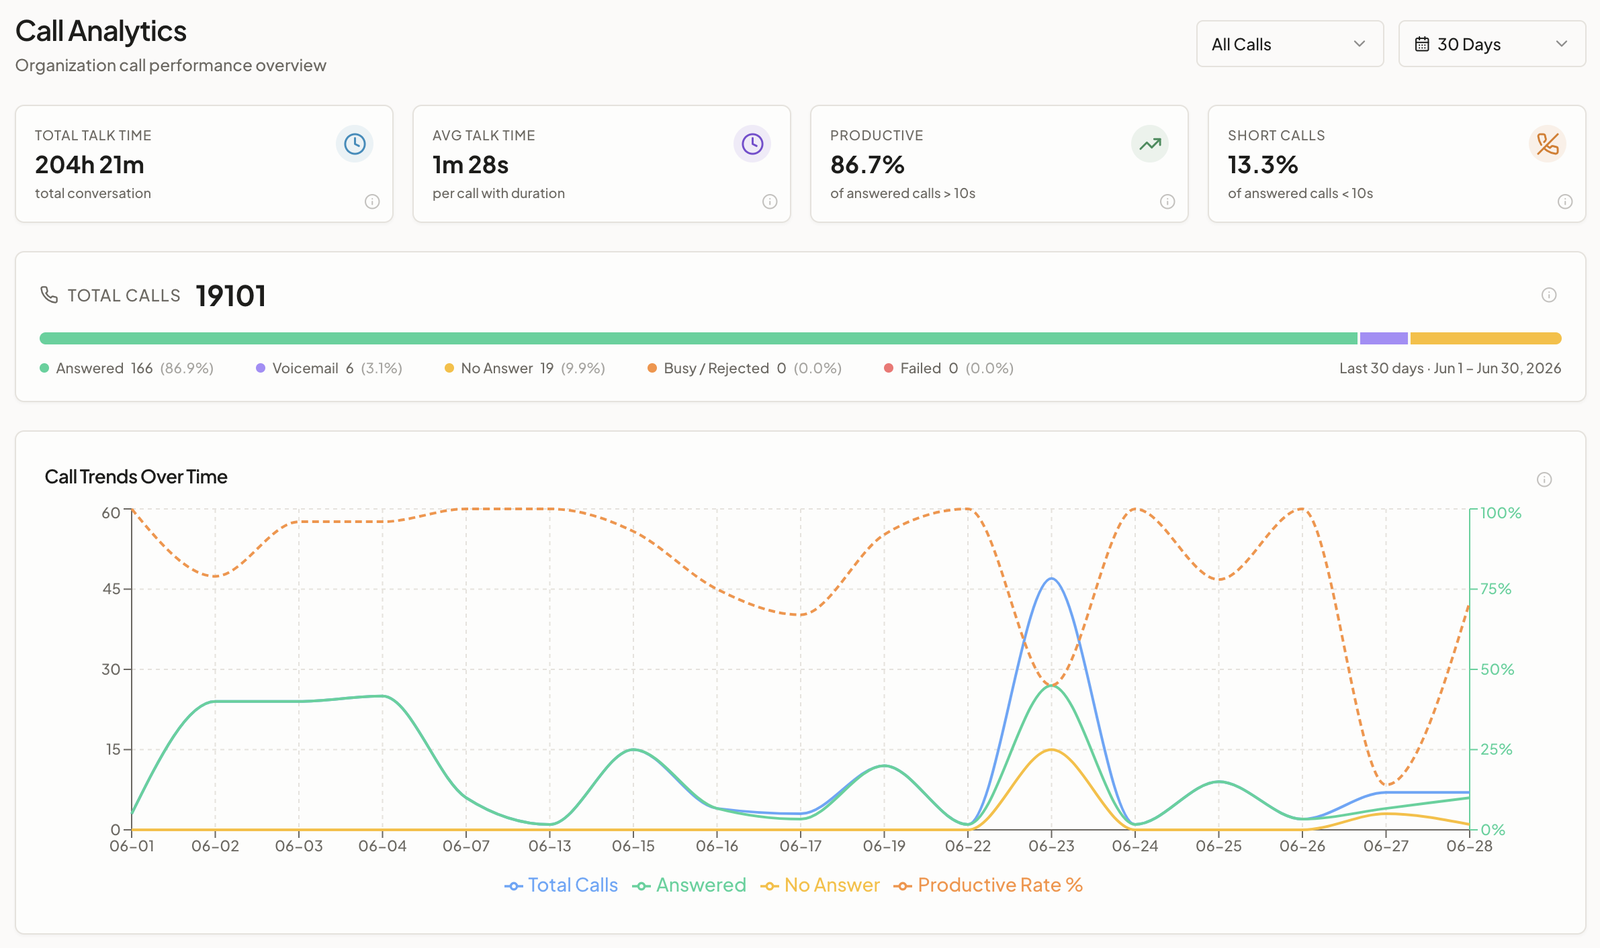
Call Analytics rolls every call up into an organization-wide performance dashboard. Open Call Analytics in the sidebar.
Filters
- Time range — Today, 7 Days, 30 Days, or 90 Days.
- Direction — All Calls, Outbound, Inbound, or Web.
Headline numbers
Four cards summarize the period:
| Card | What it means |
|---|---|
| Total Talk Time | Total conversation time across all calls |
| Avg Talk Time | Average length of answered calls that had a real duration |
| Productive | Share of answered calls with a meaningful conversation (10s+) |
| Short Calls | Share of answered calls under 10 seconds (accidental pickups, wrong numbers) |
Below them, the Total Calls bar breaks every call down by outcome: Answered, Voicemail, No Answer, Busy / Rejected, Failed.
Charts
- Call Trends Over Time — daily call volume with answered and no-answer lines, plus a productive-rate line.
- Duration Distribution — answered calls bucketed by length (under 10s, 10–30s, 30–60s, 1–2m, 2–5m, 5m+).
- Campaign Performance — top campaigns by answer rate and average duration. (Pick a direction to see a Direction Split, or, for inbound, a Disposition Breakdown instead.)
- Top Agents by Volume — which agents handled the most calls, with answer rate and average duration.
Not sure how a number is calculated? Click the info icon on any card or chart — each one shows its formula and a worked example.
For a single conversation, see View call logs.
Was this page helpful?